How to Build a Report with Skyo
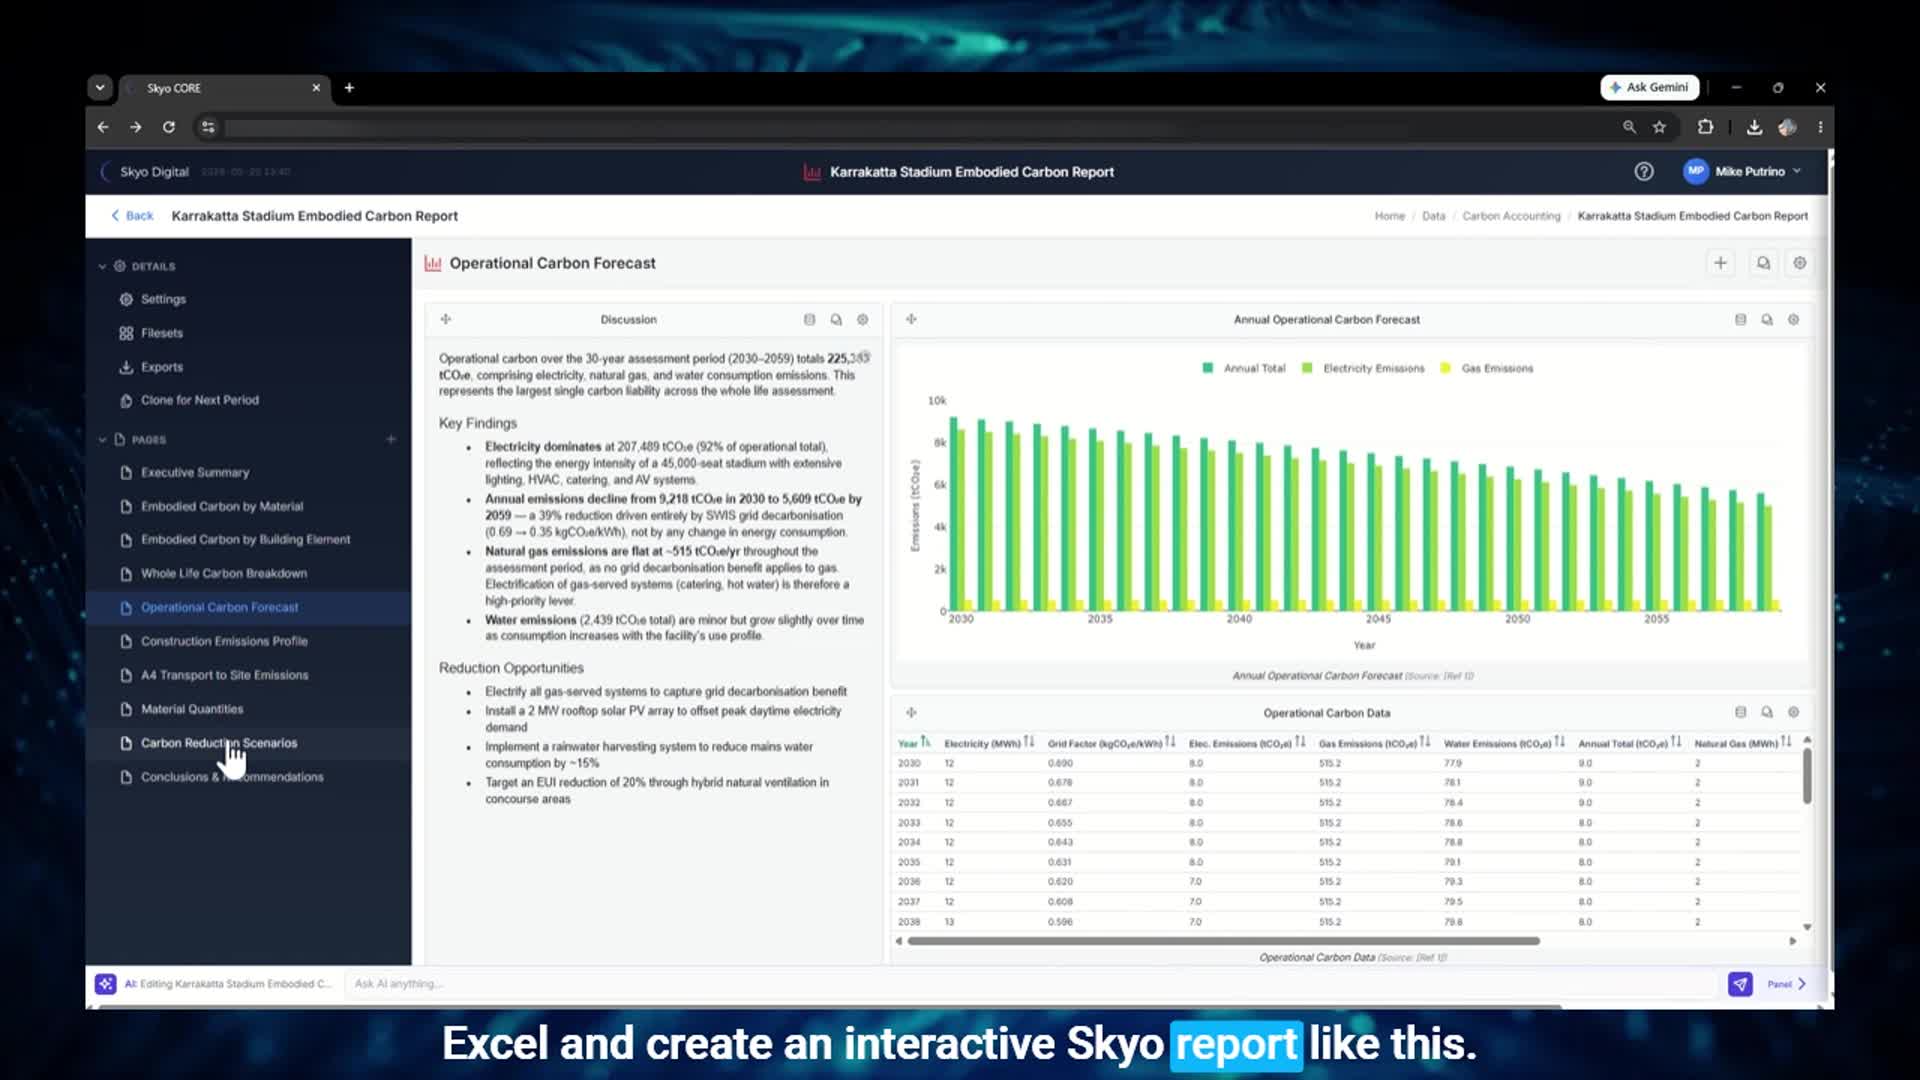
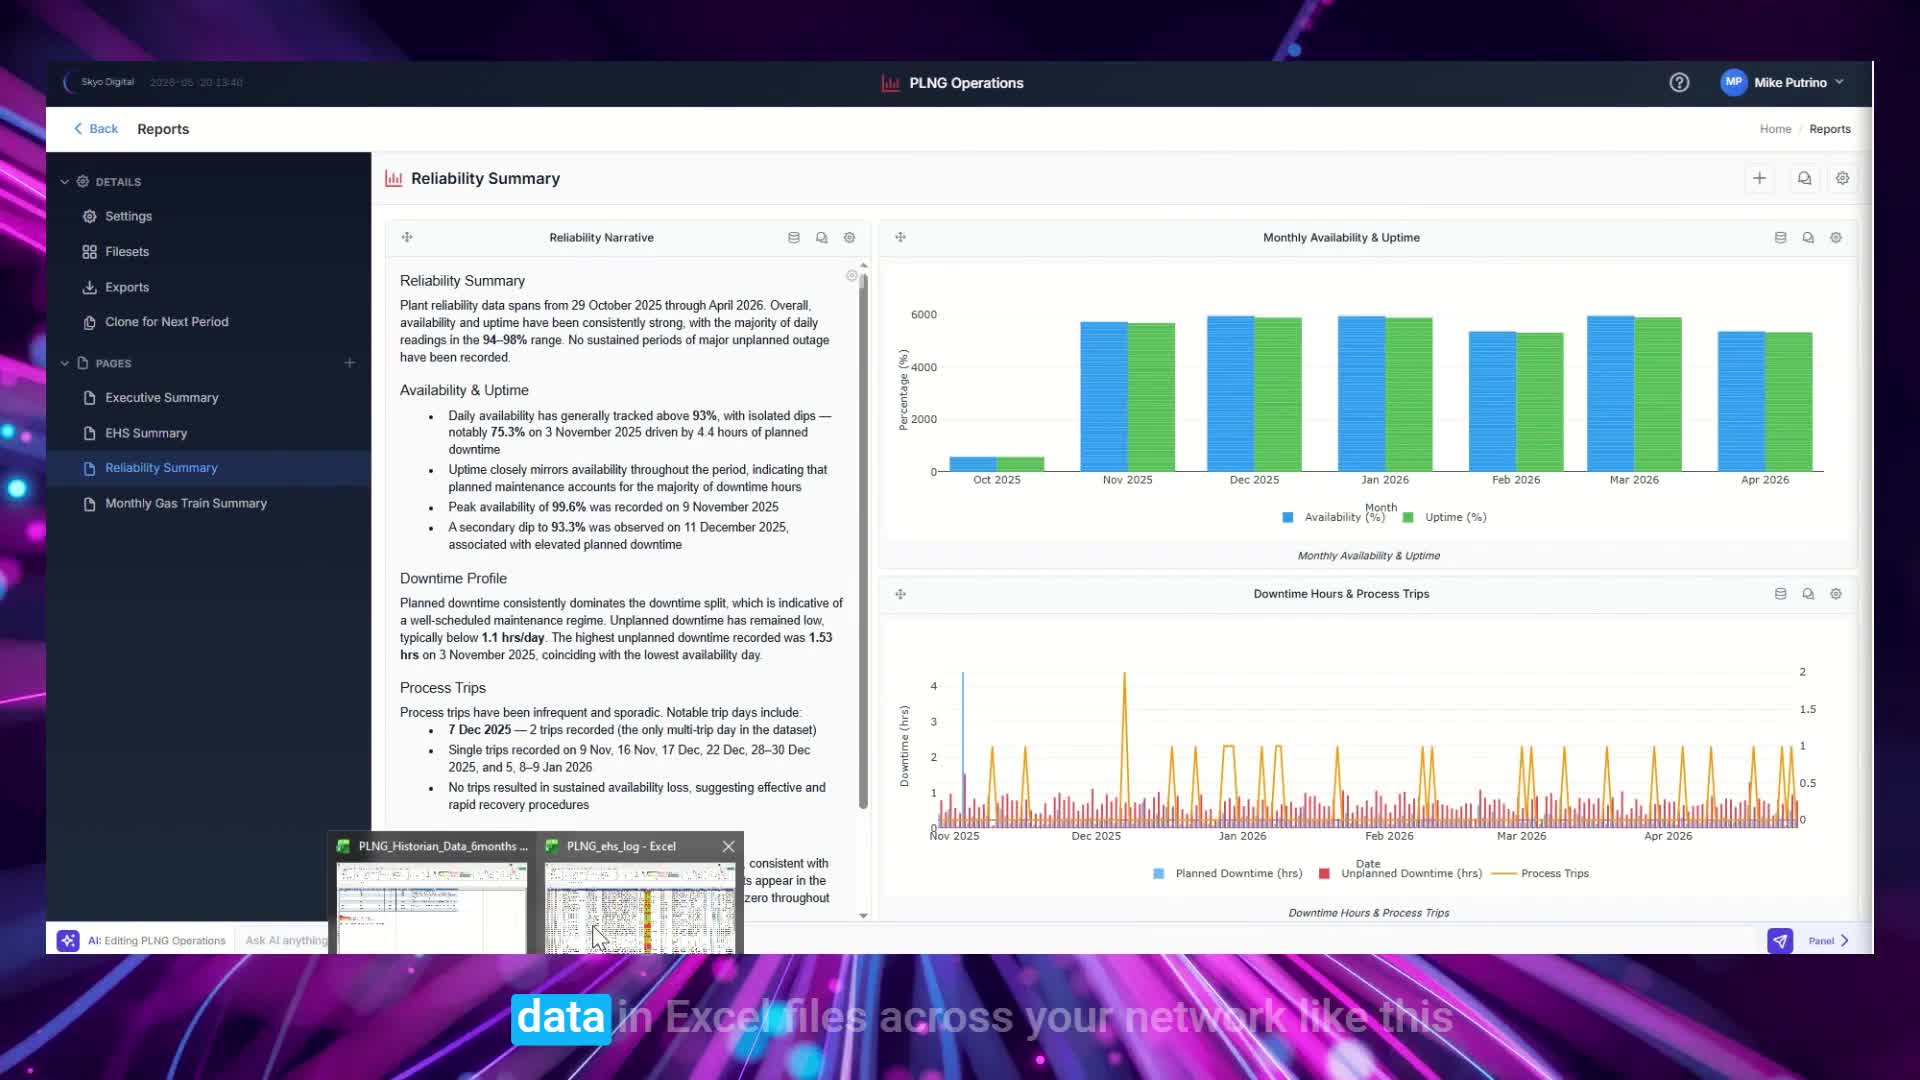
See how quickly you can turn complex engineering data into polished presentations with Skyo. This video walks through creating a gas project presentation from real-world files—bringing together messy Excel sheets, simulation outputs, and structured datasets into a clean, AI-generated report. Watch as Skyo automatically builds sections, generates charts, and creates interactive visuals in seconds. With simple prompts, you can refine layouts, update data, and add new analysis on the fly. It’s a powerful look at how engineers can streamline reporting, improve consistency, and dramatically reduce the time it takes to deliver high-quality technical presentations.
Next